Data· Feb 2026
Unemployment Analysis — India
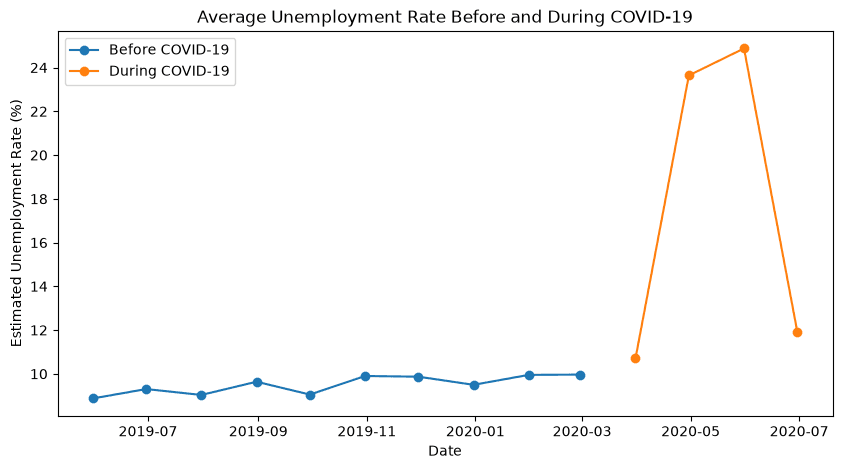
Exploratory analysis showing India's unemployment rate jump from ~10% to ~25% in two months of COVID-19 lockdown.
- peak national unemployment, May 2020
- 24.9%
- Built with
- PythonpandasNumPyMatplotlibseabornJupyter
Problem
How hard did COVID-19 hit jobs in India? The raw dataset has monthly unemployment for 28 states and territories, split into rural and urban — too granular to answer the question at a glance, and easy to misread.
Approach
- Cleaning: found and dropped 28 fully-empty rows; parsed day-month-year dates explicitly.
- Correct aggregation: averaged ~50 state/area readings per month into one national figure, instead of plotting a misleading zig-zag of raw rows.
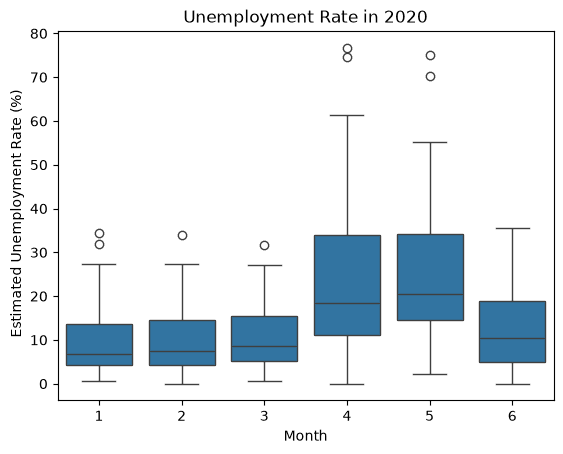
- Visualisation: trend lines before vs. during the pandemic, plus yearly and monthly box plots to show the spread across states.
- Plain-language insights summarised at the end of the notebook.
Results
| Result | |
|---|---|
| Pre-COVID average (May 2019 – Mar 2020) | ~9–10%, very stable |
| Peak national average | 24.9% in May 2020 (23.6% in April) |
| Highest single reading | 76.7% — urban Puducherry, April 2020 |
| June 2020 | Back down to ~12%, still above pre-pandemic levels |
In April and May the spread between states exploded too — some regions were hit far harder than others.
What I learned
- Always check the data's granularity before plotting: grouping by date first fixed a chart that made the average look like 30–35%.
- Verify every claim with a number.
- Don't call something seasonal without enough history — 14 months shows a one-off shock, not a pattern.
- Cleaning comes first.
Dataset
"Unemployment in India" dataset (Kaggle).
More visuals